IBTrACS v04r01 · NI Basin · 1842–2025
A data-driven exploration of 183 years of tropical cyclones over the Bay of Bengal — where storms are born, how they move, and what the long record reveals about a changing ocean.
Track Density
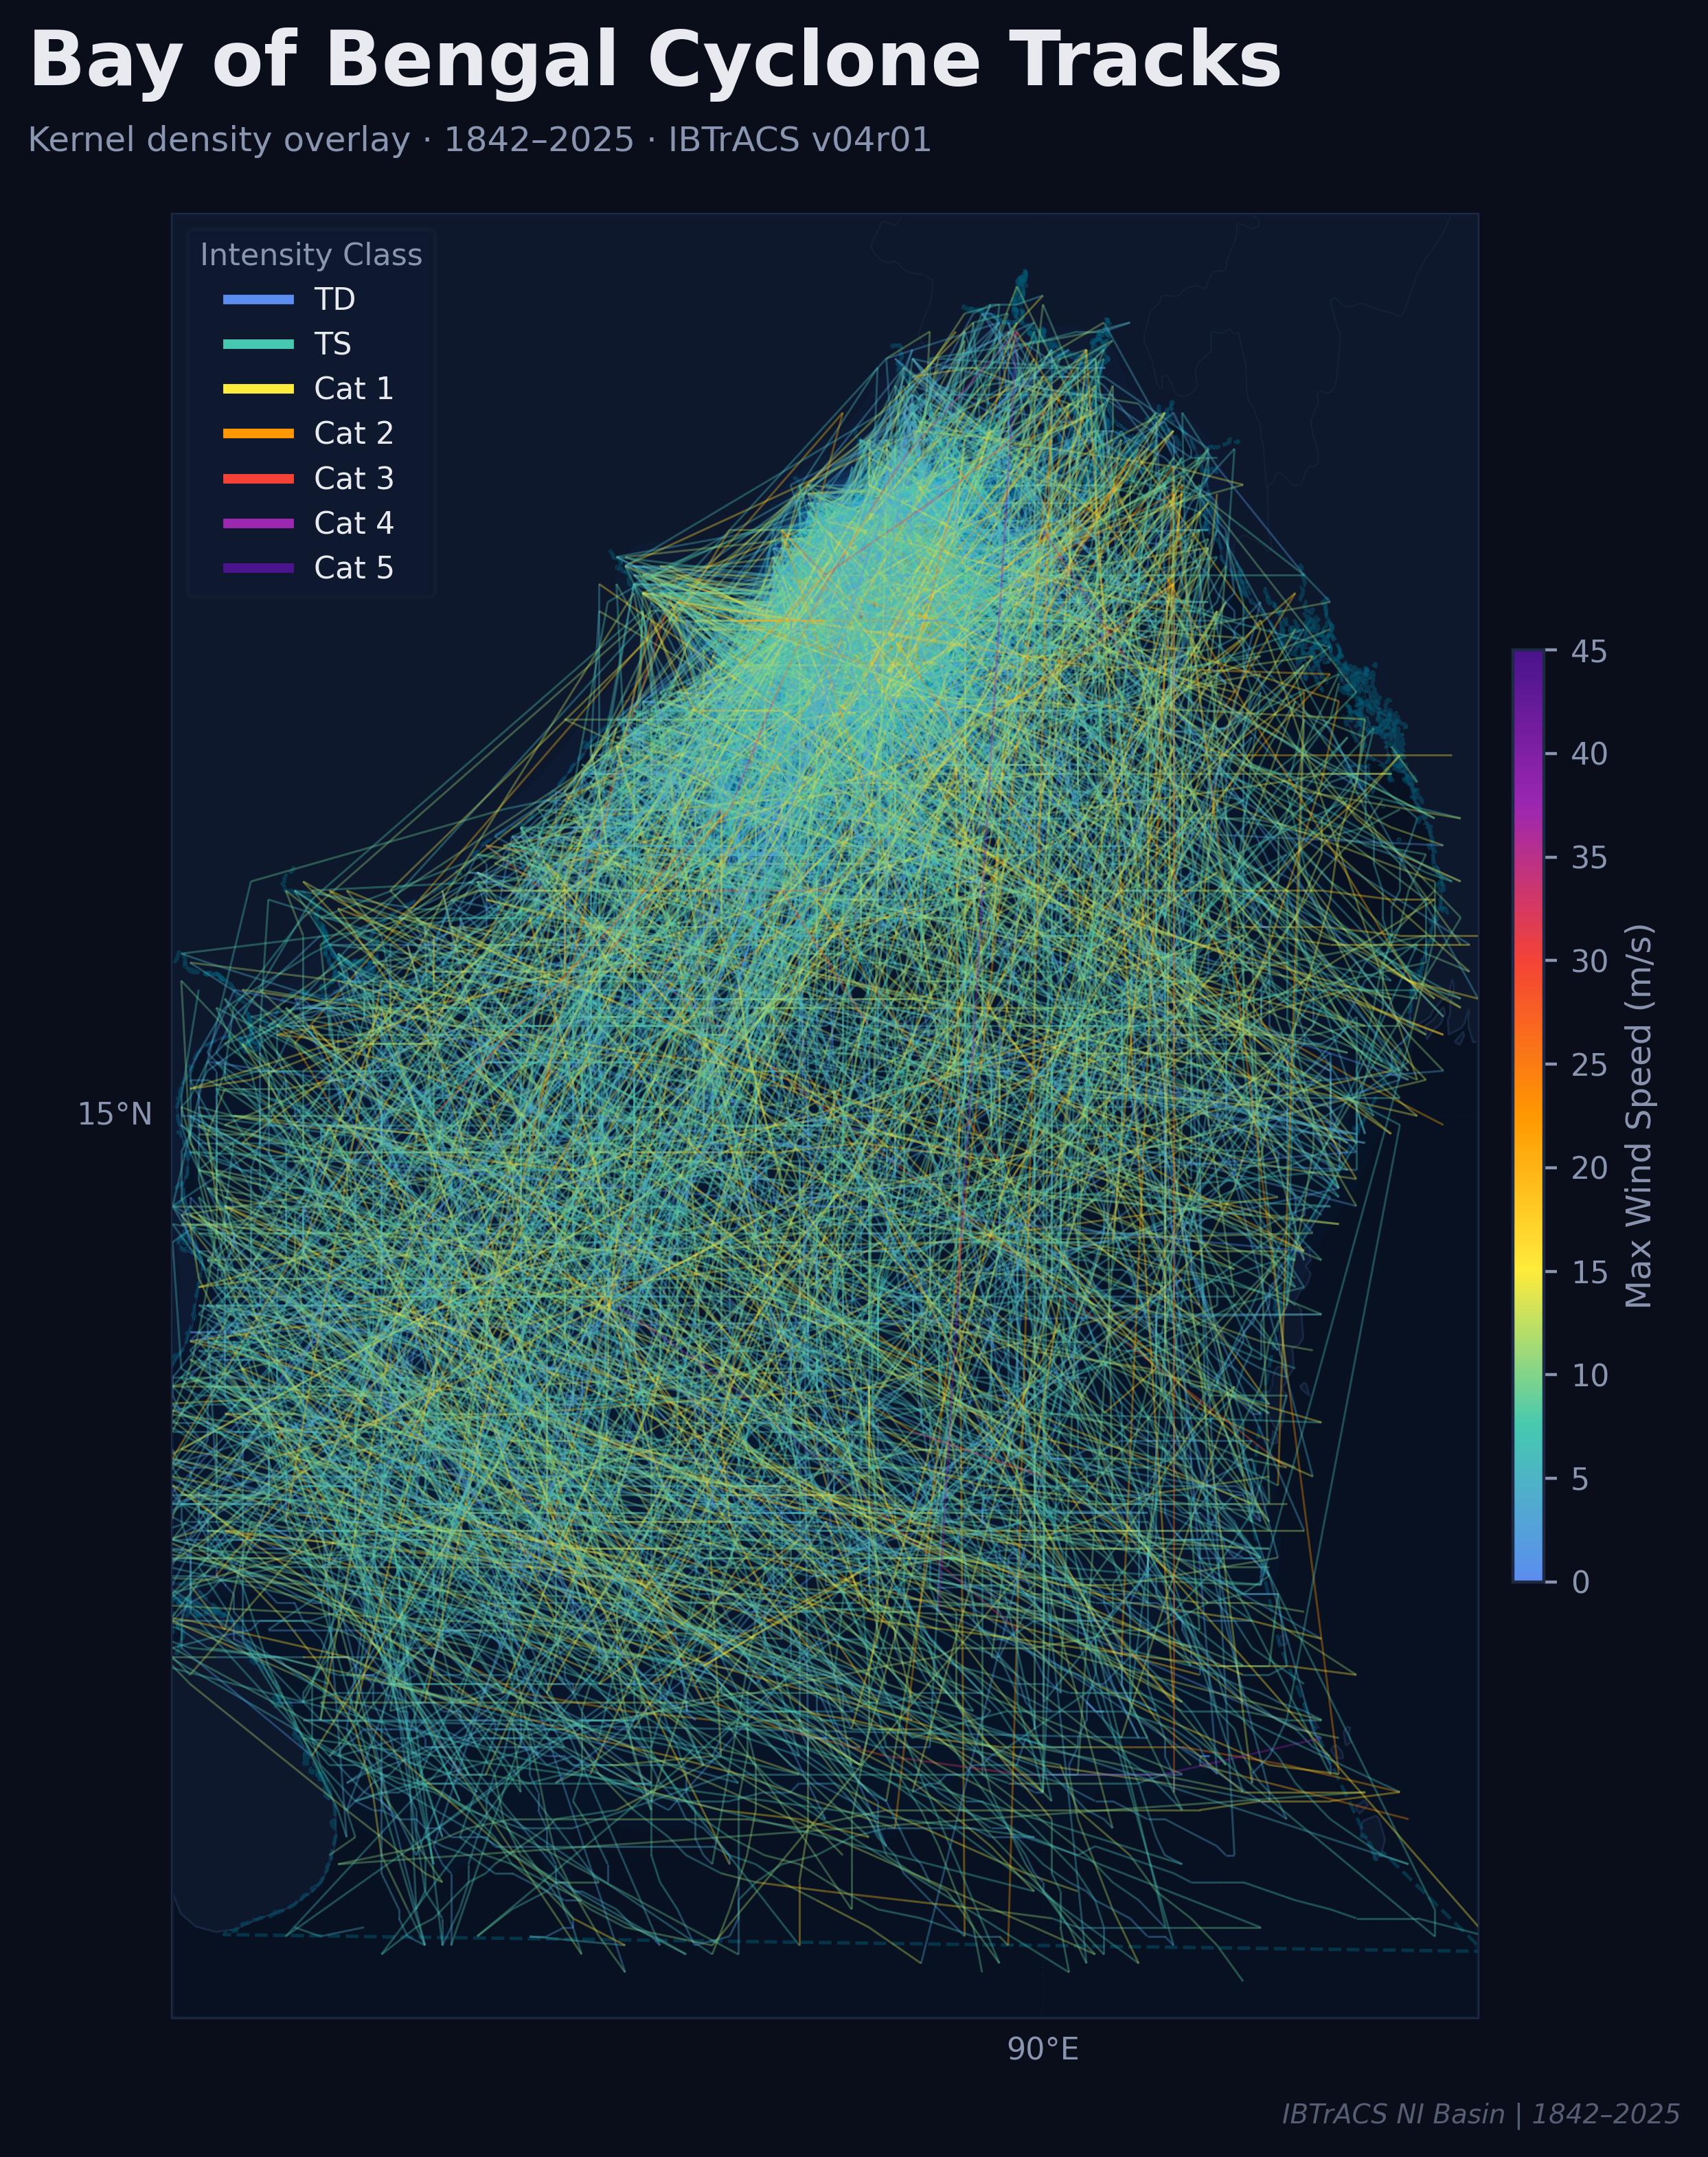
The kernel density overlay of all IBTrACS North Indian Basin tracks reveals the Bay of Bengal's circulation anatomy. The hottest corridor arcs north-northeast from ~10°N toward the Bangladesh-Myanmar coast, where storm convergence is densest. Yellow-orange threads mark the most intense systems slicing through the central Bay.
Annual Trend 1970–2025
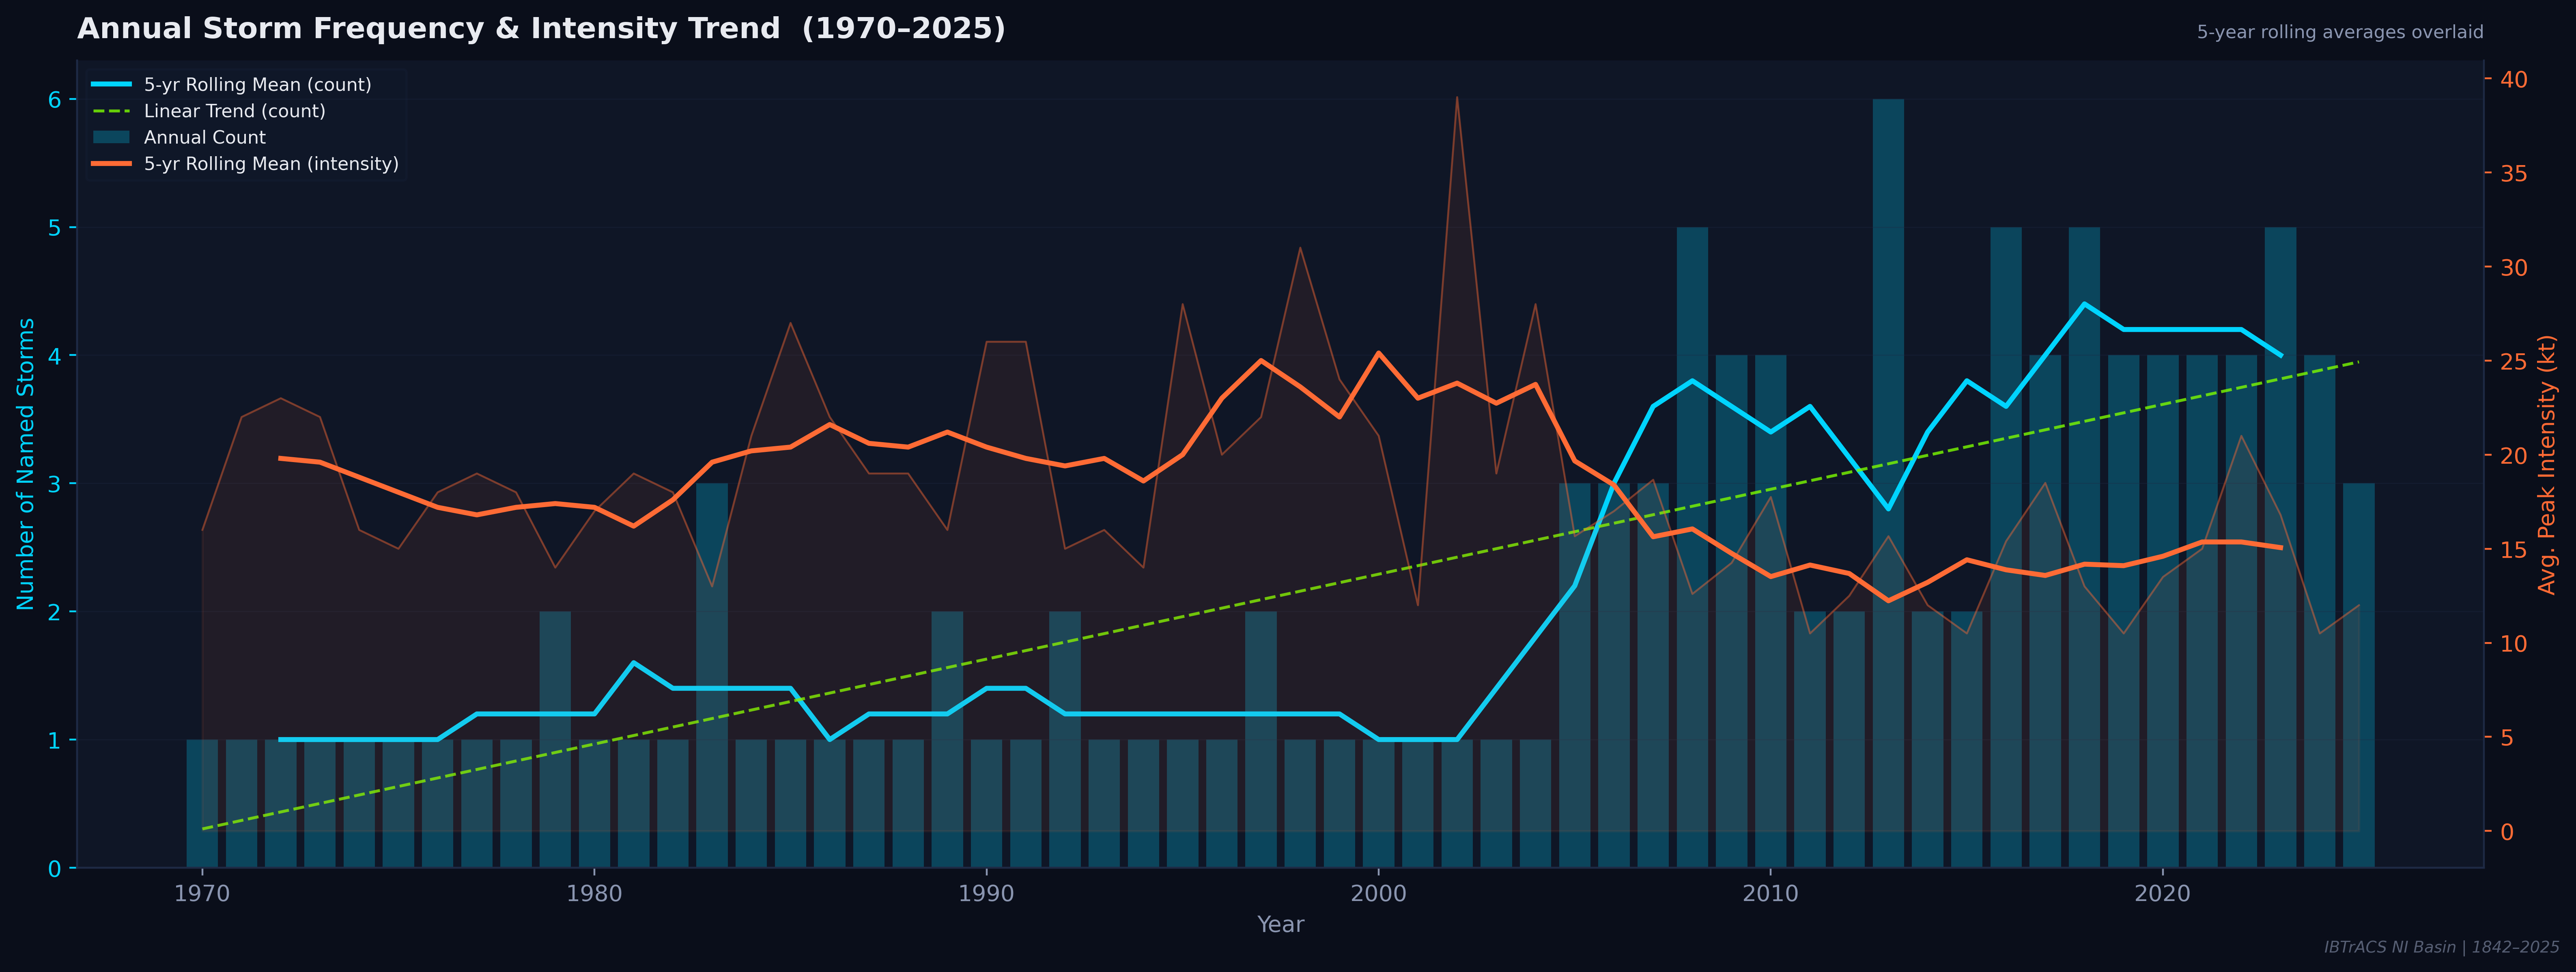
The 55-year record tells a clear story: storm frequency has roughly tripled since the 1970s, yet average peak intensity has not kept pace. The green dashed linear trend in storm counts climbs steadily from ~0.5/yr to nearly 4/yr — while the orange intensity curve oscillates without a strong upward signal after 2000.
Seasonal Cycle
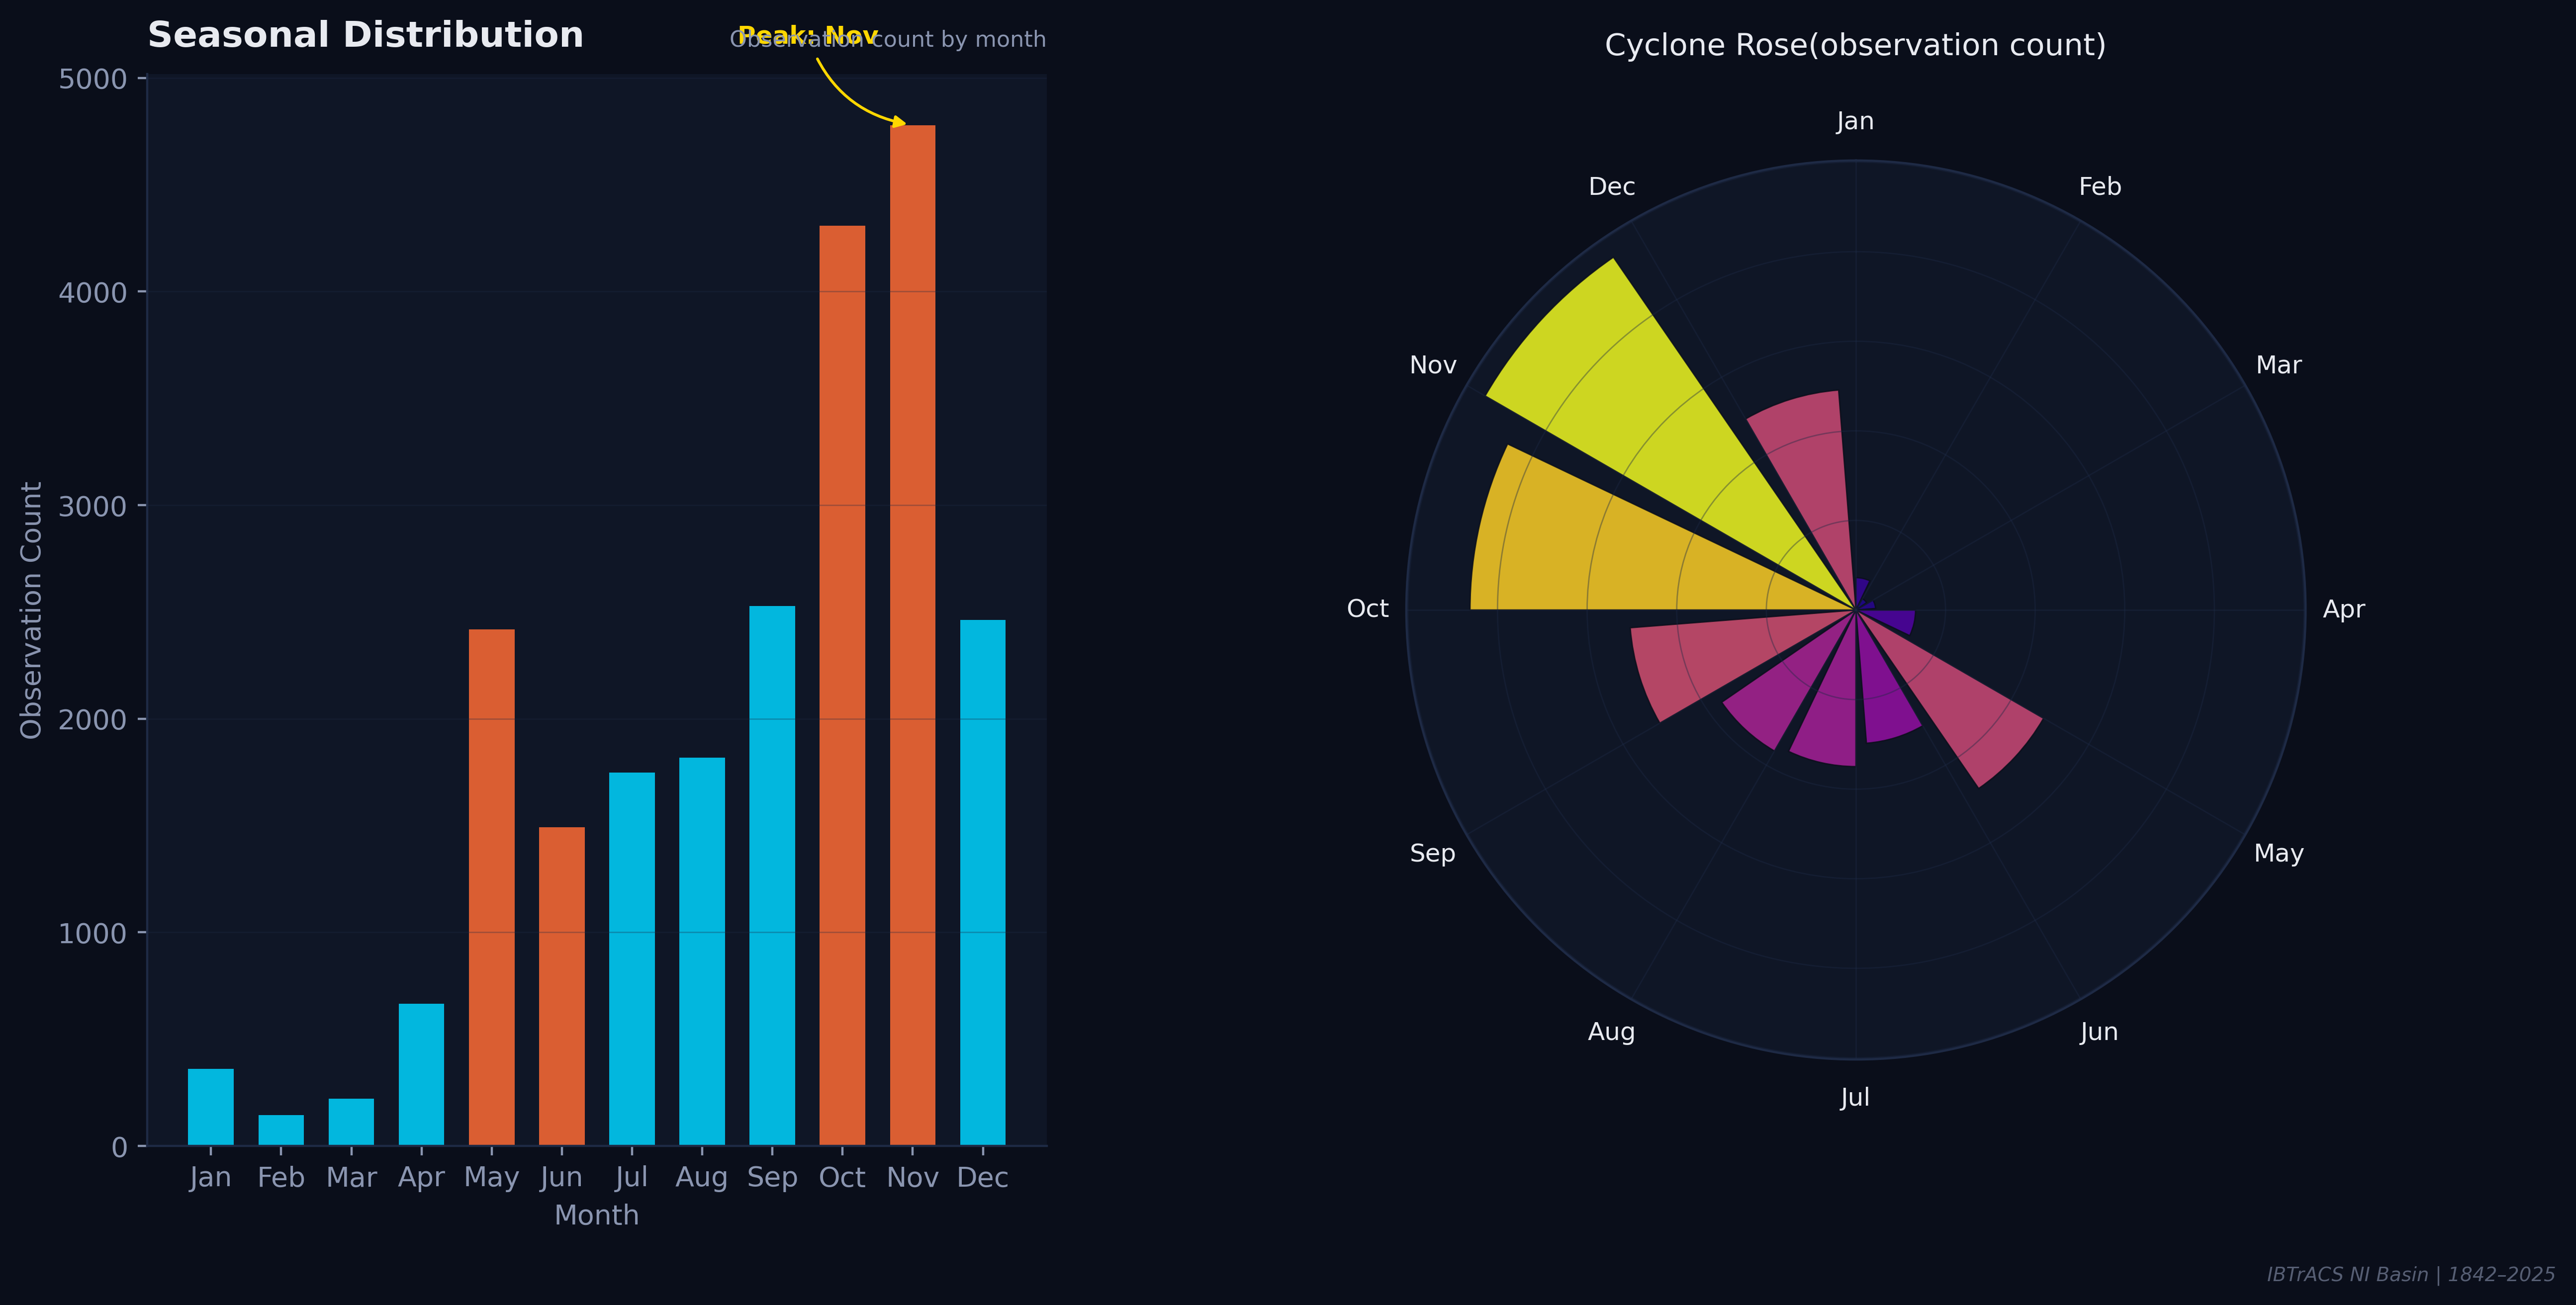
Unlike the Atlantic basin with a single September peak, the Bay of Bengal has a bimodal season. Post-monsoon (October–December) strongly dominates, with November as the absolute maximum. A secondary pre-monsoon peak emerges in April–May, bookending the June–September monsoon suppression period when wind shear inhibits cyclogenesis.
Intensity Distribution
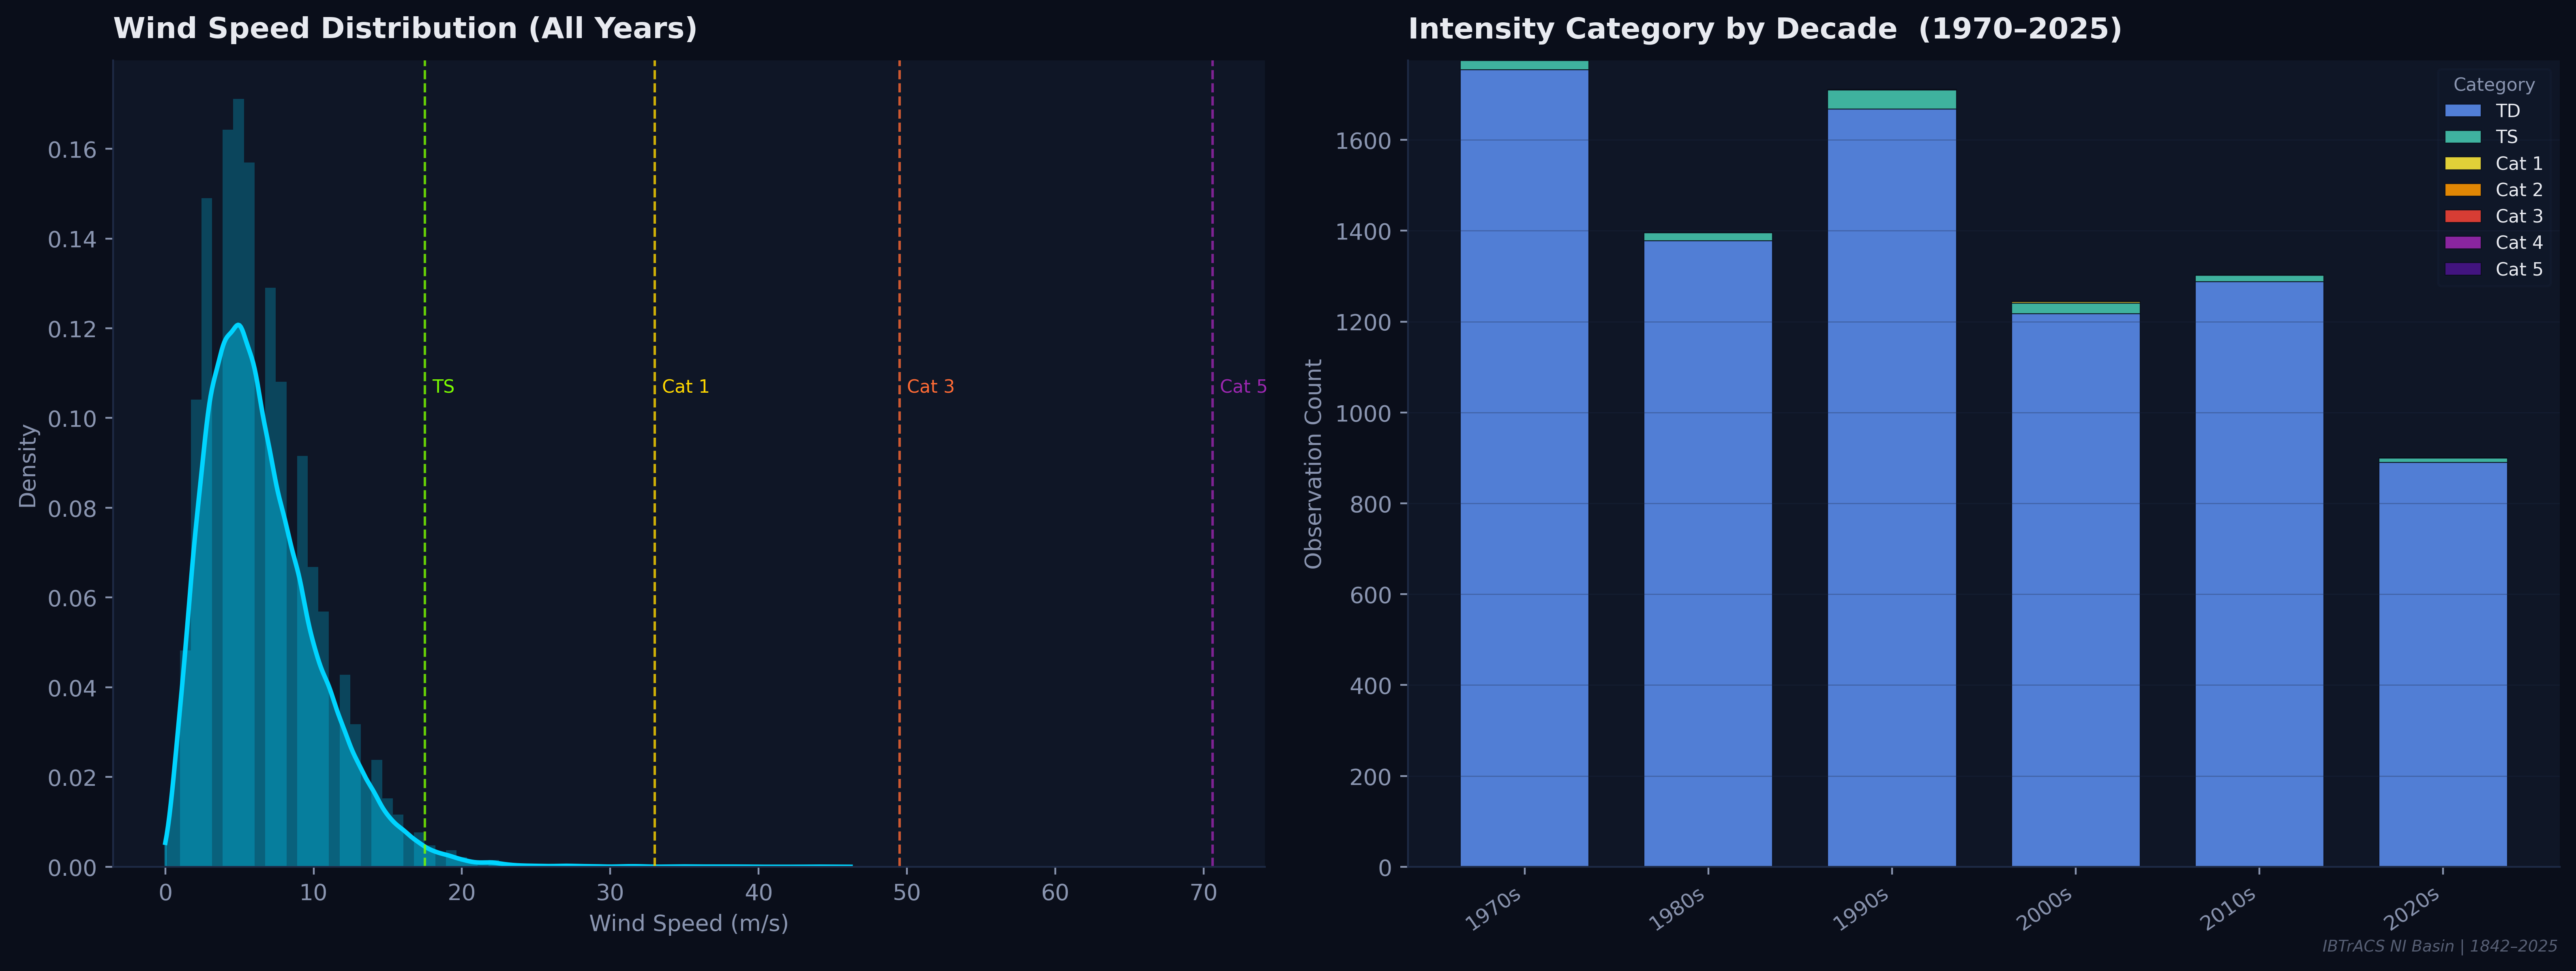
The wind-speed distribution is sharply right-skewed: the mode sits below 10 m/s (tropical depression strength), and the curve drops steeply toward Cat 1+ thresholds. Yet the right tail — rare but deadly — represents all major landfalling disasters. The decade stacked bars confirm that TD-class (blue) dominates every era.
Genesis Points
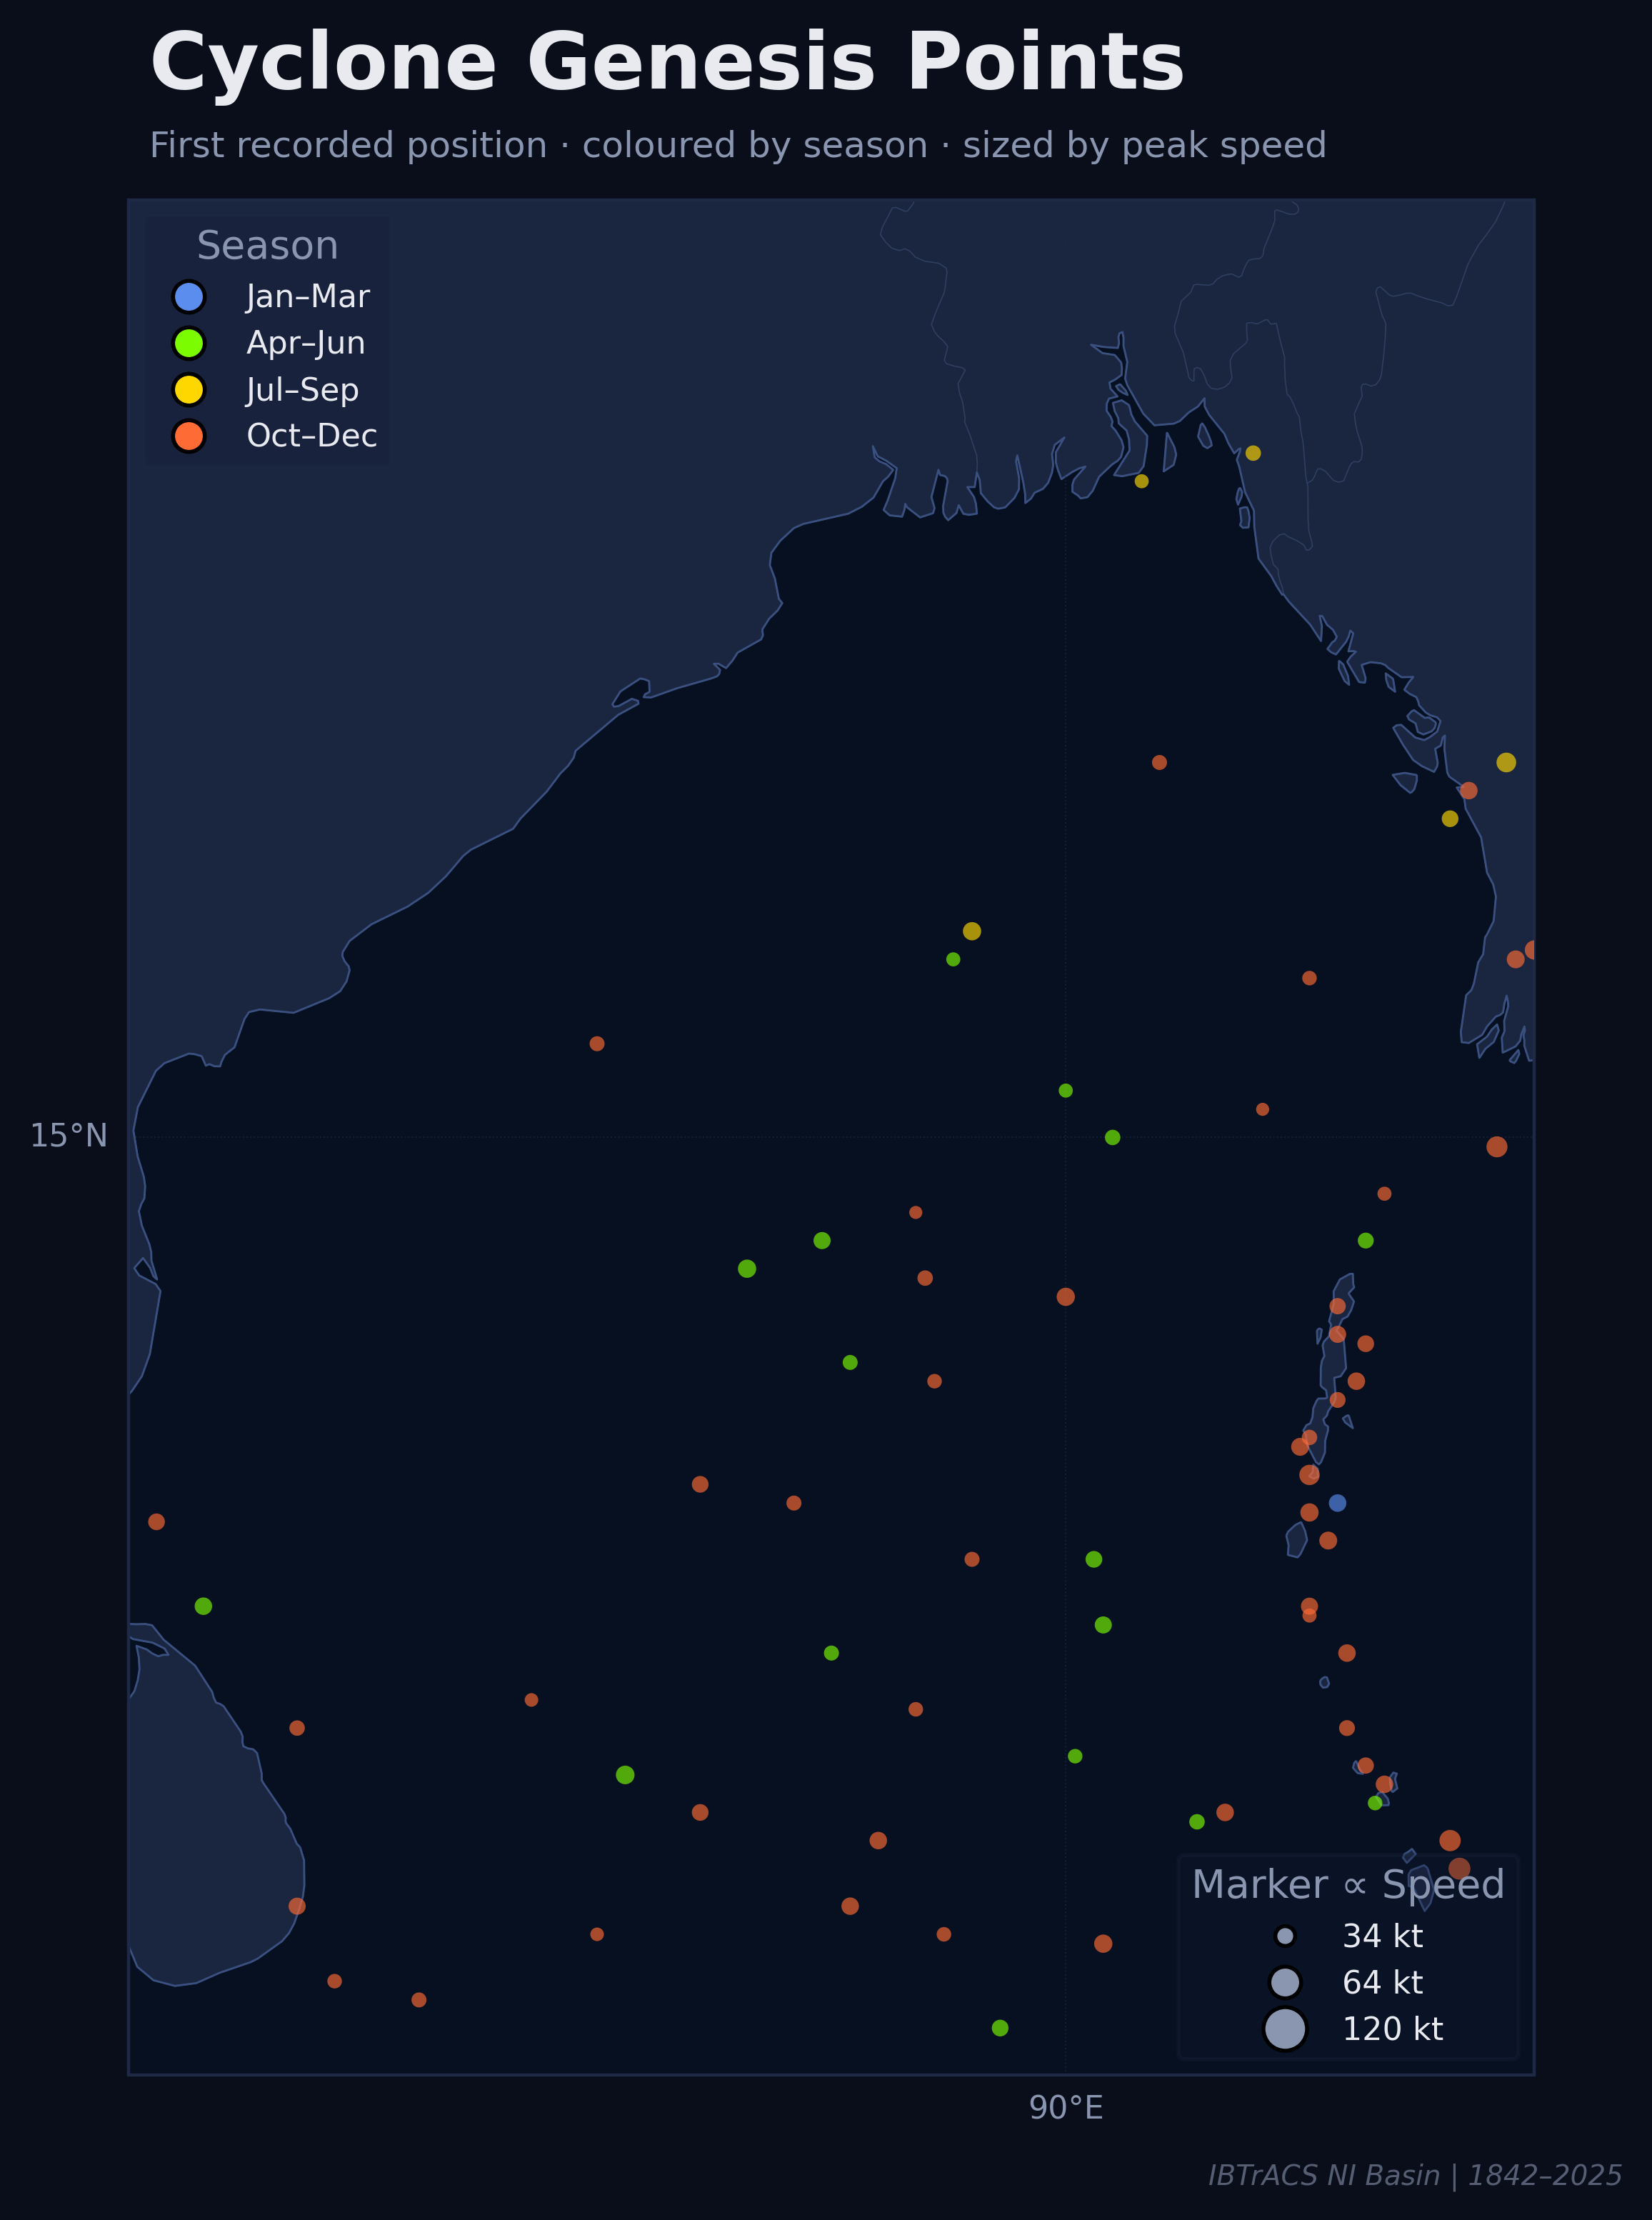
Genesis points — the first recorded position of each storm — tell us where atmospheric and oceanic conditions conspire to spin up circulation. The Bay shows a striking clustering of Oct–Dec genesis (orange) across the southern and central basin, while Apr–Jun storms (green) emerge slightly further south. Larger markers signal higher peak speeds.
The dense cluster along the eastern coast (~90–95°E, 10–15°N) represents storms generated near the Andaman Sea and northern Indian Ocean — a known nursery tied to the Inter-Tropical Convergence Zone and monsoonal moisture flux.
Landfall Analysis
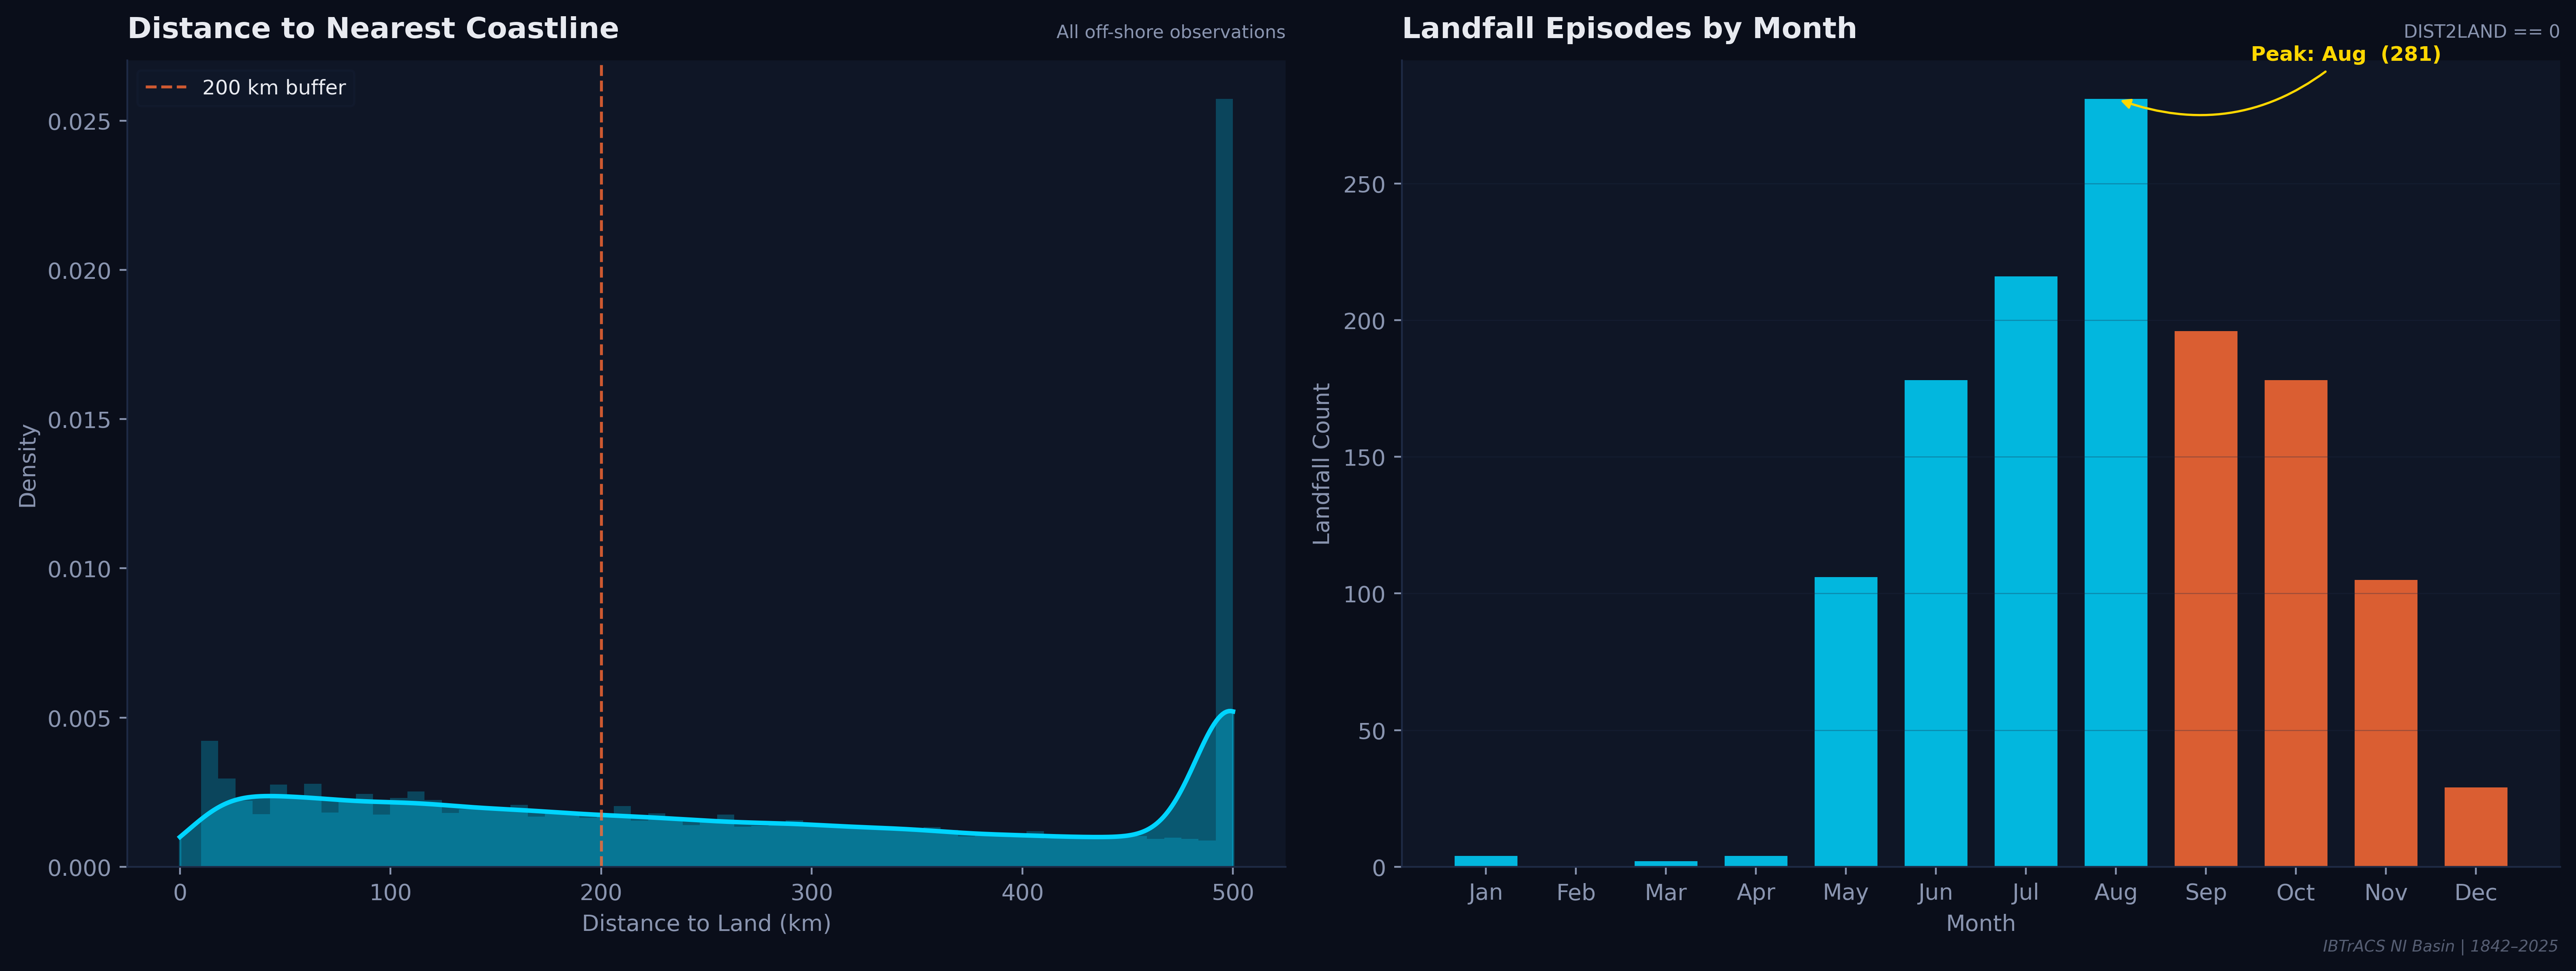
While November produces the most storms at sea, August registers the peak landfall count (281 episodes). This counterintuitive split reflects that monsoon-season storms, though weaker, tend to track directly into coastlines — while post-monsoon systems often recurve or dissipate over the open ocean.
Frequency of landfall and intensity of landfall are driven by different seasons. Bangladesh, Odisha, and Andhra Pradesh face their highest landfall probability in August, but their highest landfall intensity exposure in October–November.
Decade × Month Heatmap
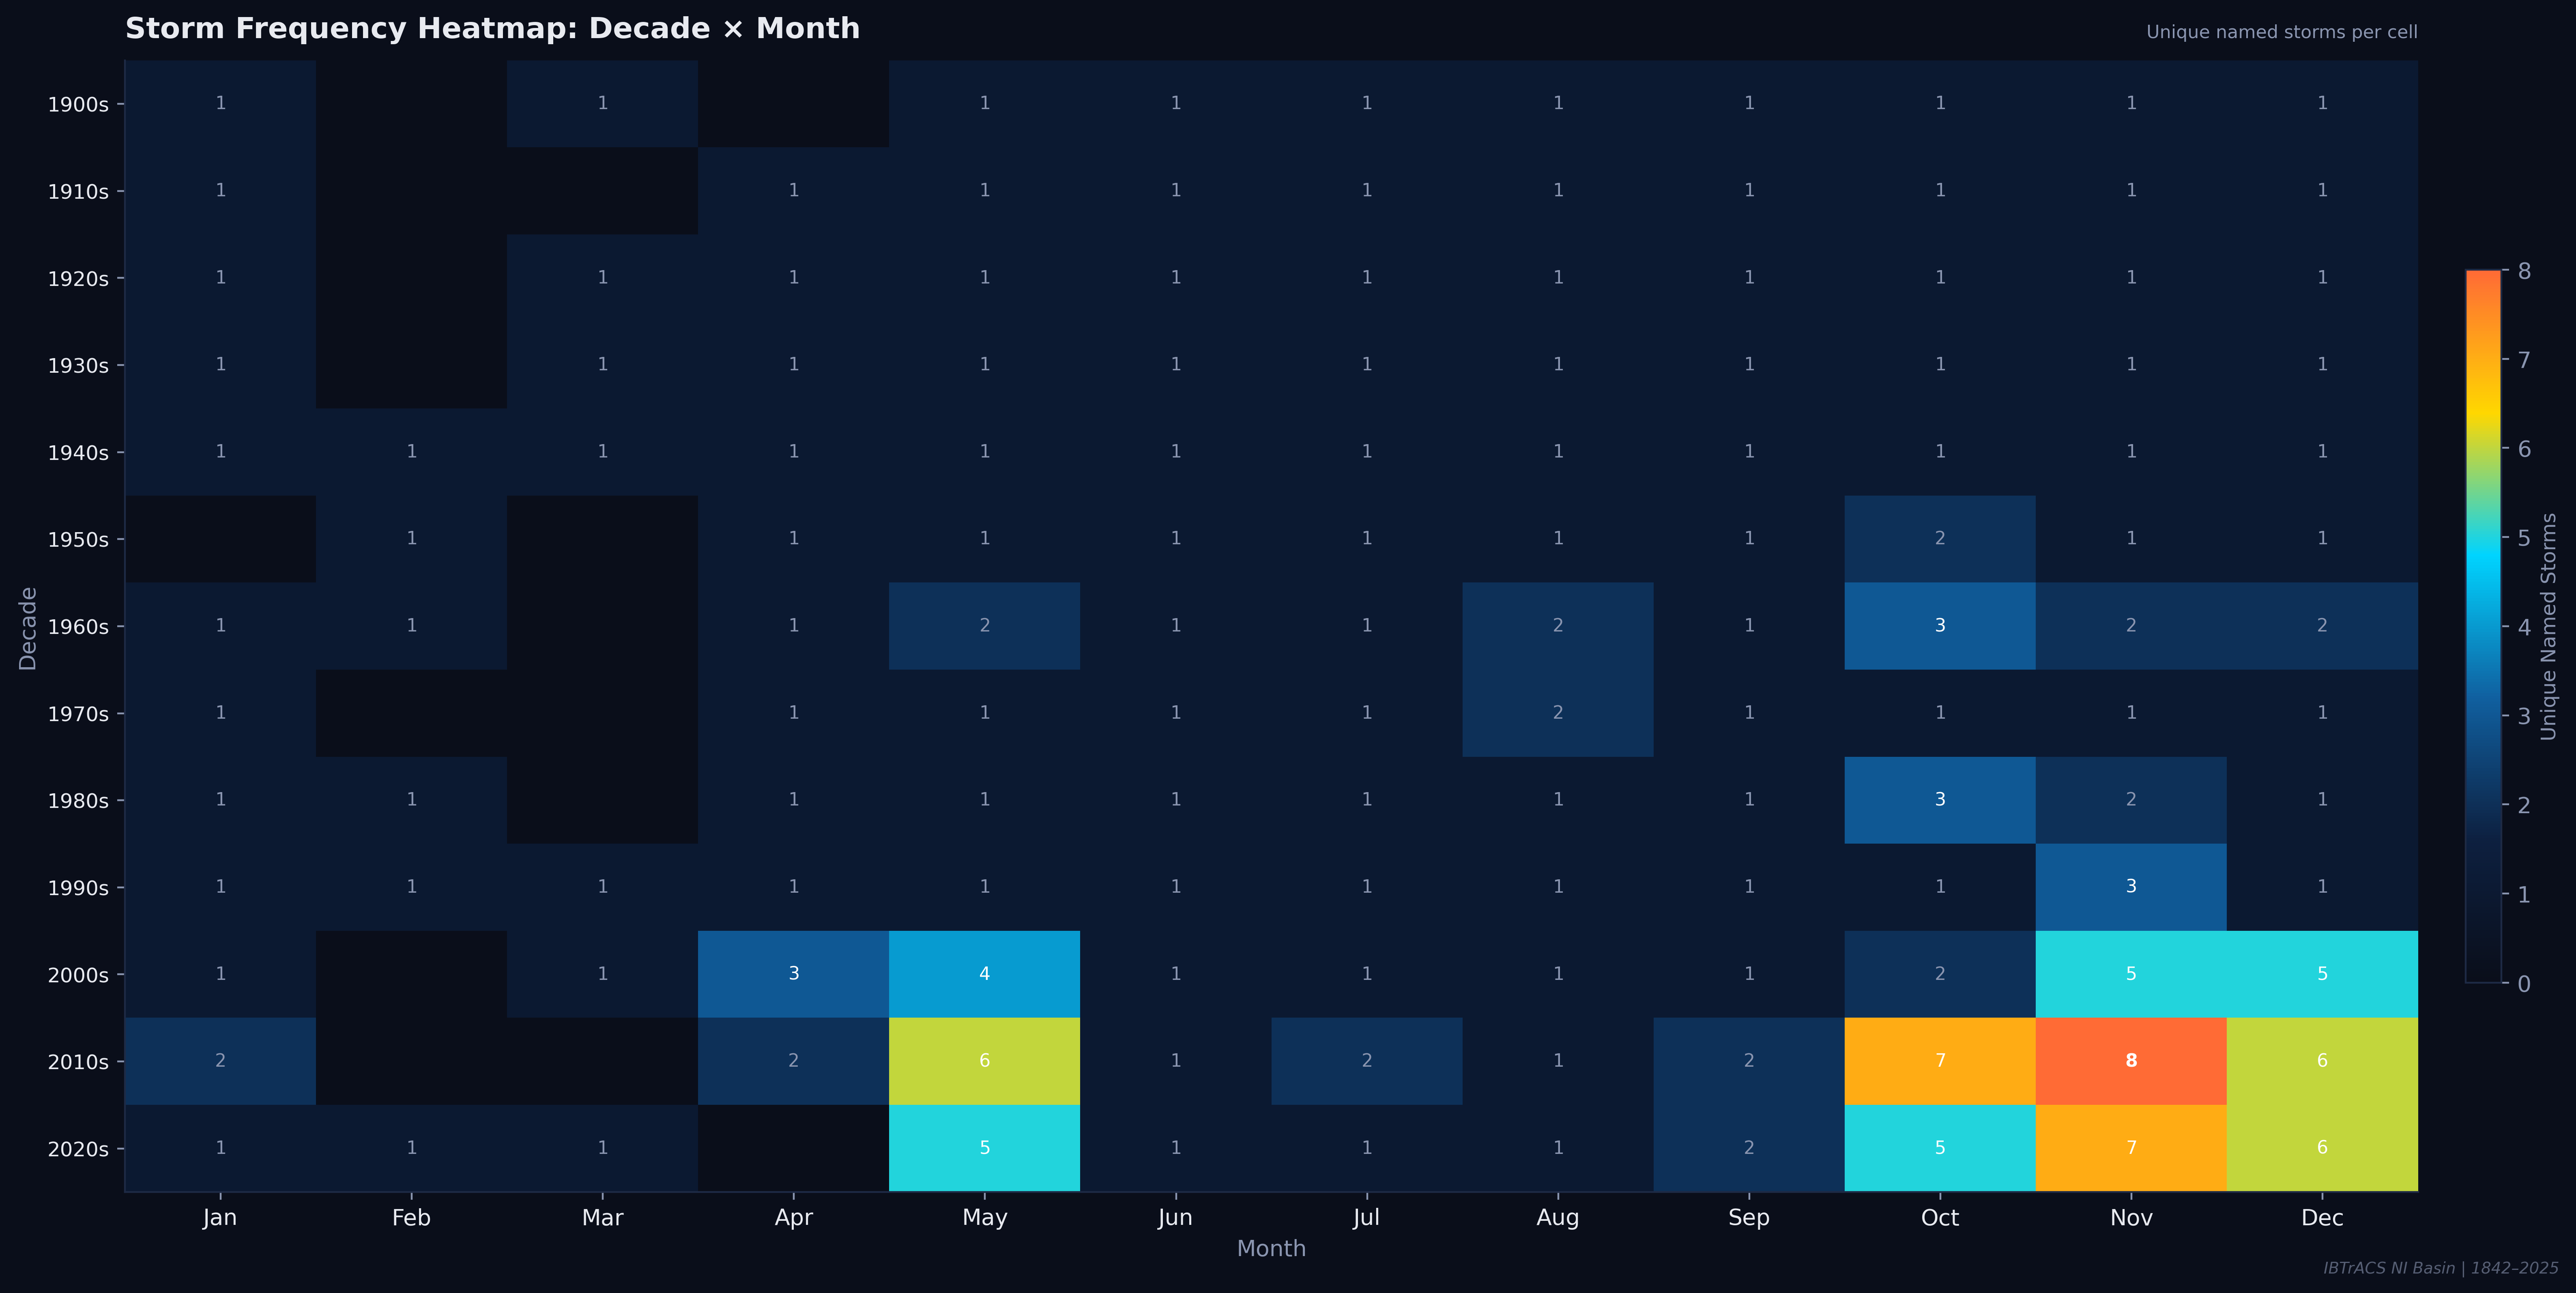
Each cell shows the count of unique named storms per month-decade combination. The pre-satellite era (pre-1960s) is sparse and uniform, but post-2000 cells light up dramatically — especially May, October, and November in the 2010s, which glow yellow-orange with 6–8 storms per cell.
Record-Setters
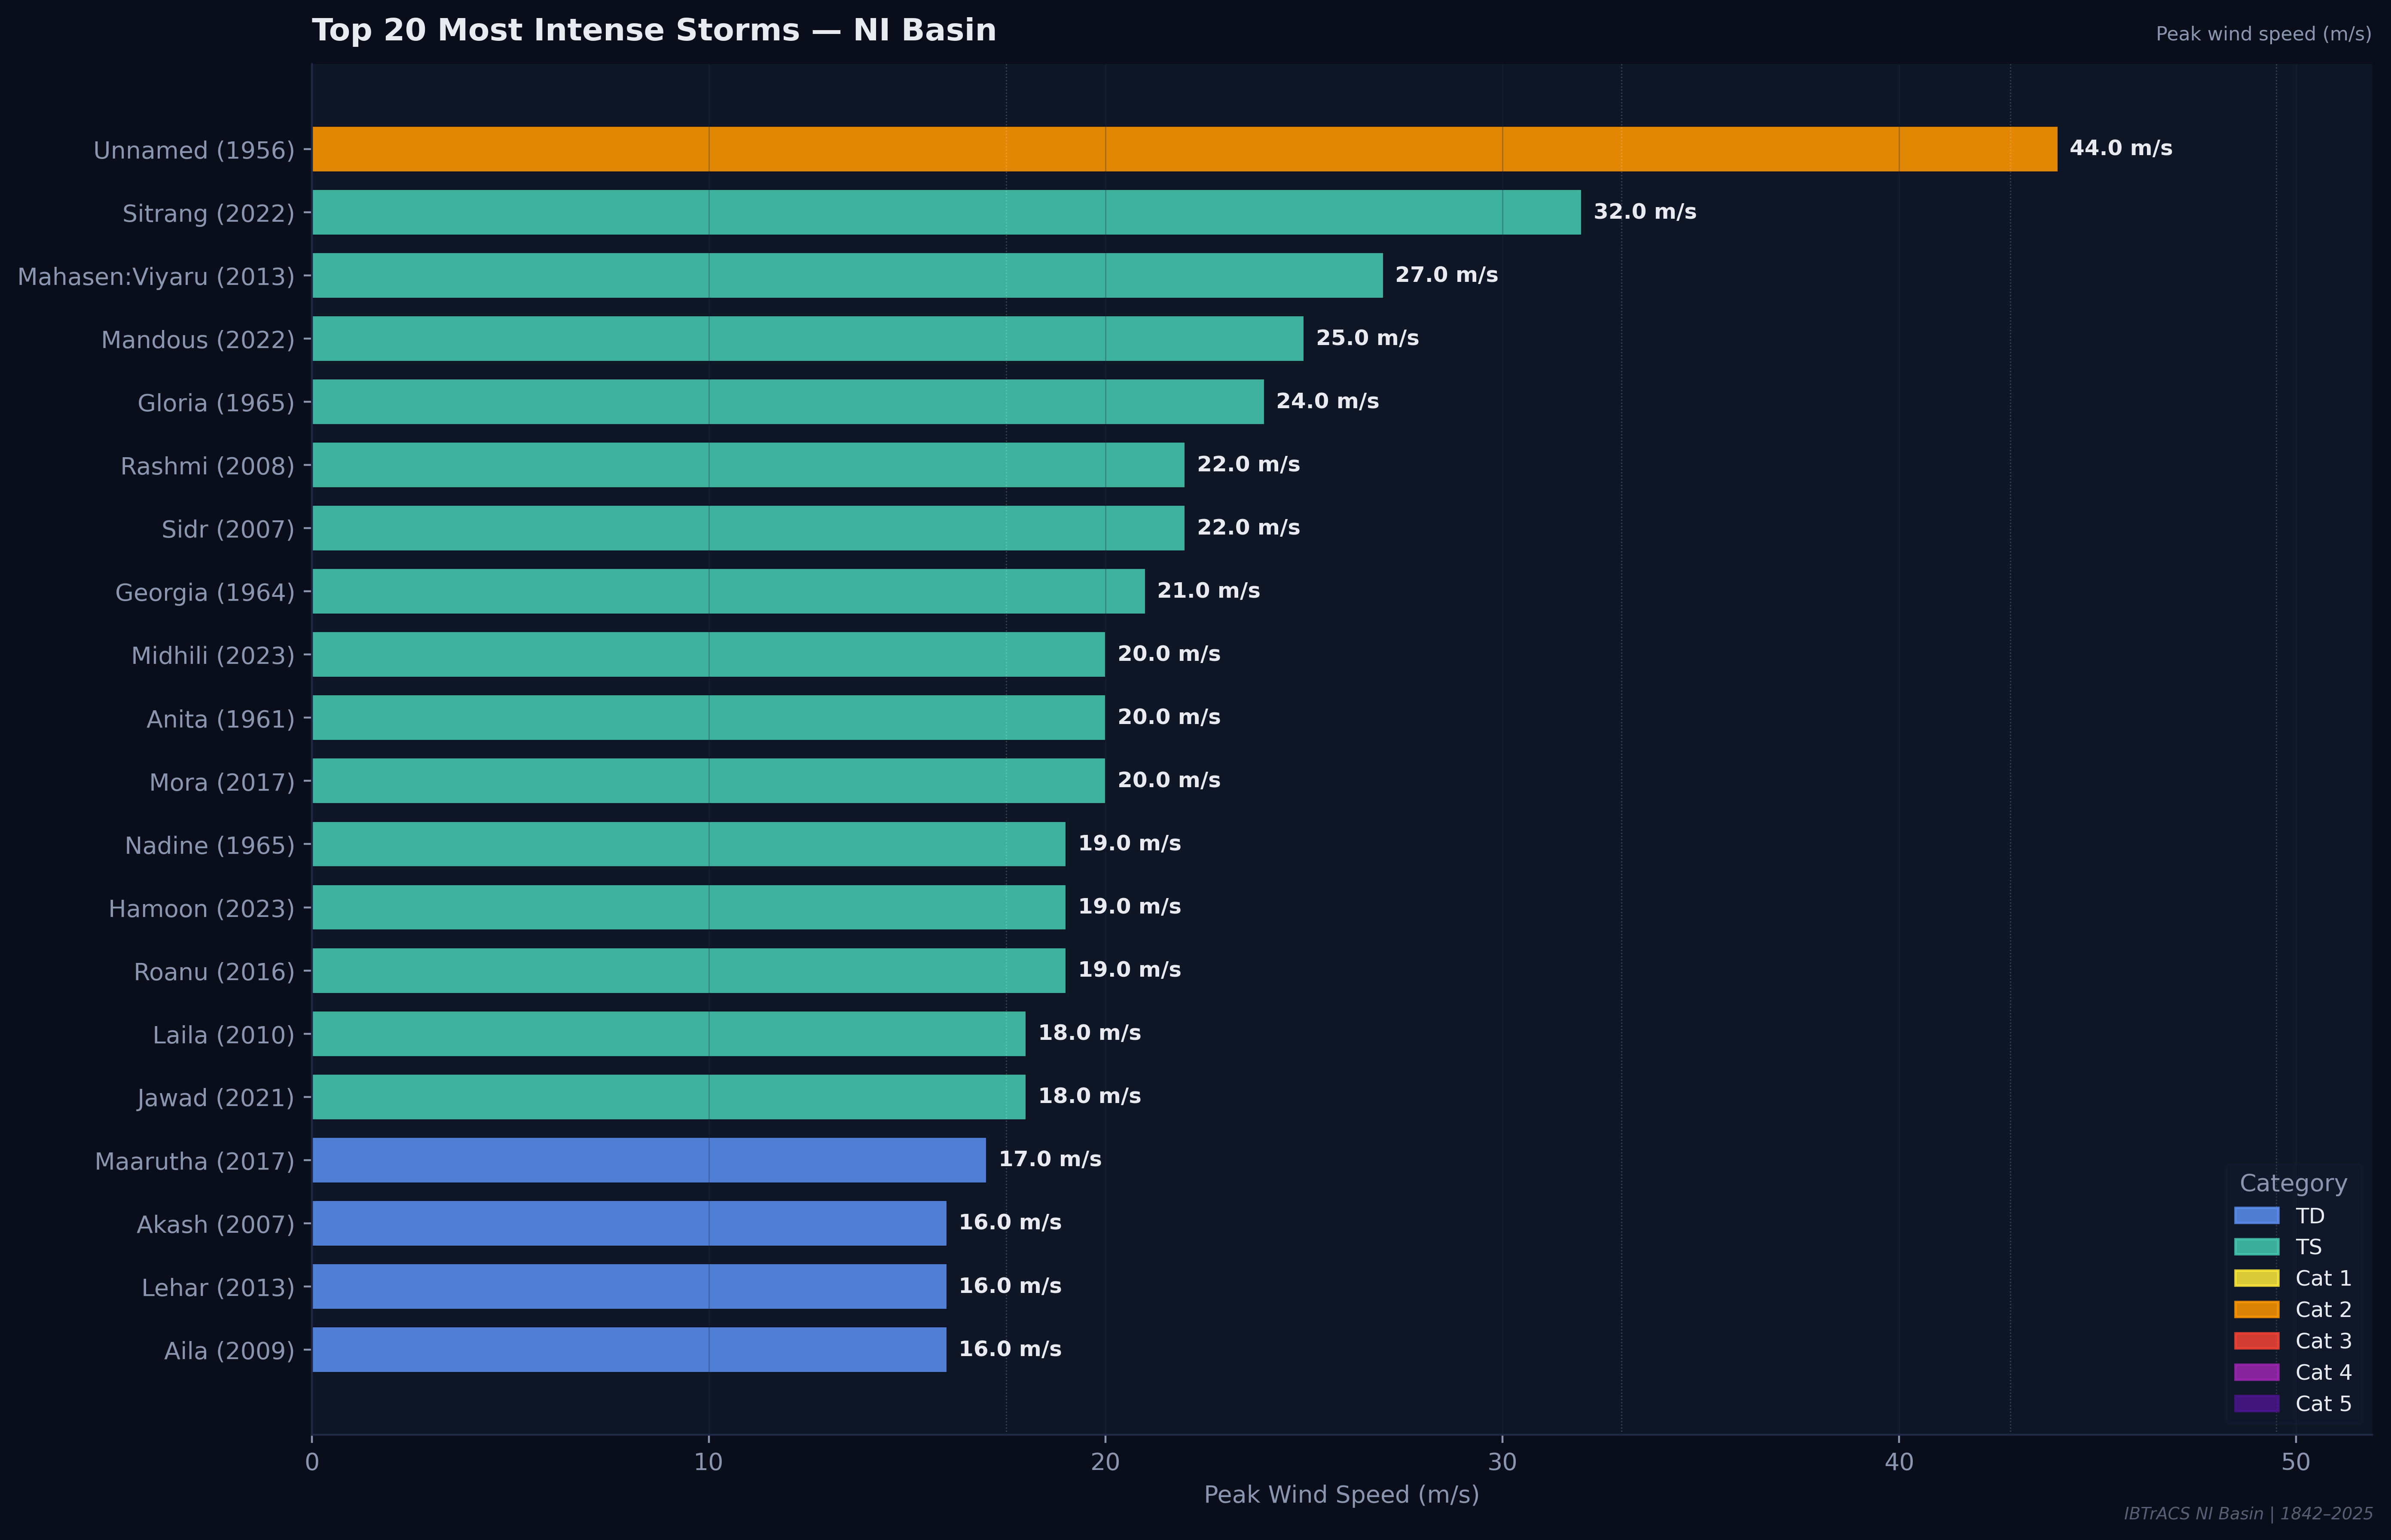
An unnamed 1956 storm towers above all others at 44 m/s peak wind — classified as Category 1. Sitrang (2022) follows at 32 m/s, and Mahasen/Viyaru (2013) at 27 m/s. Remarkably, most "top 20" storms are Tropical Storm (TS) class, reflecting the Bay's character as a basin that spins up frequent but rarely super-intense systems.
The recent decade (2007–2023) contributes 11 of the top 20 entries, including Sidr (2007), Rashmi (2008), Aila (2009), and Midhili (2023) — suggesting improved observational records are capturing systems that would have been missed in earlier decades.
Rapid Intensification
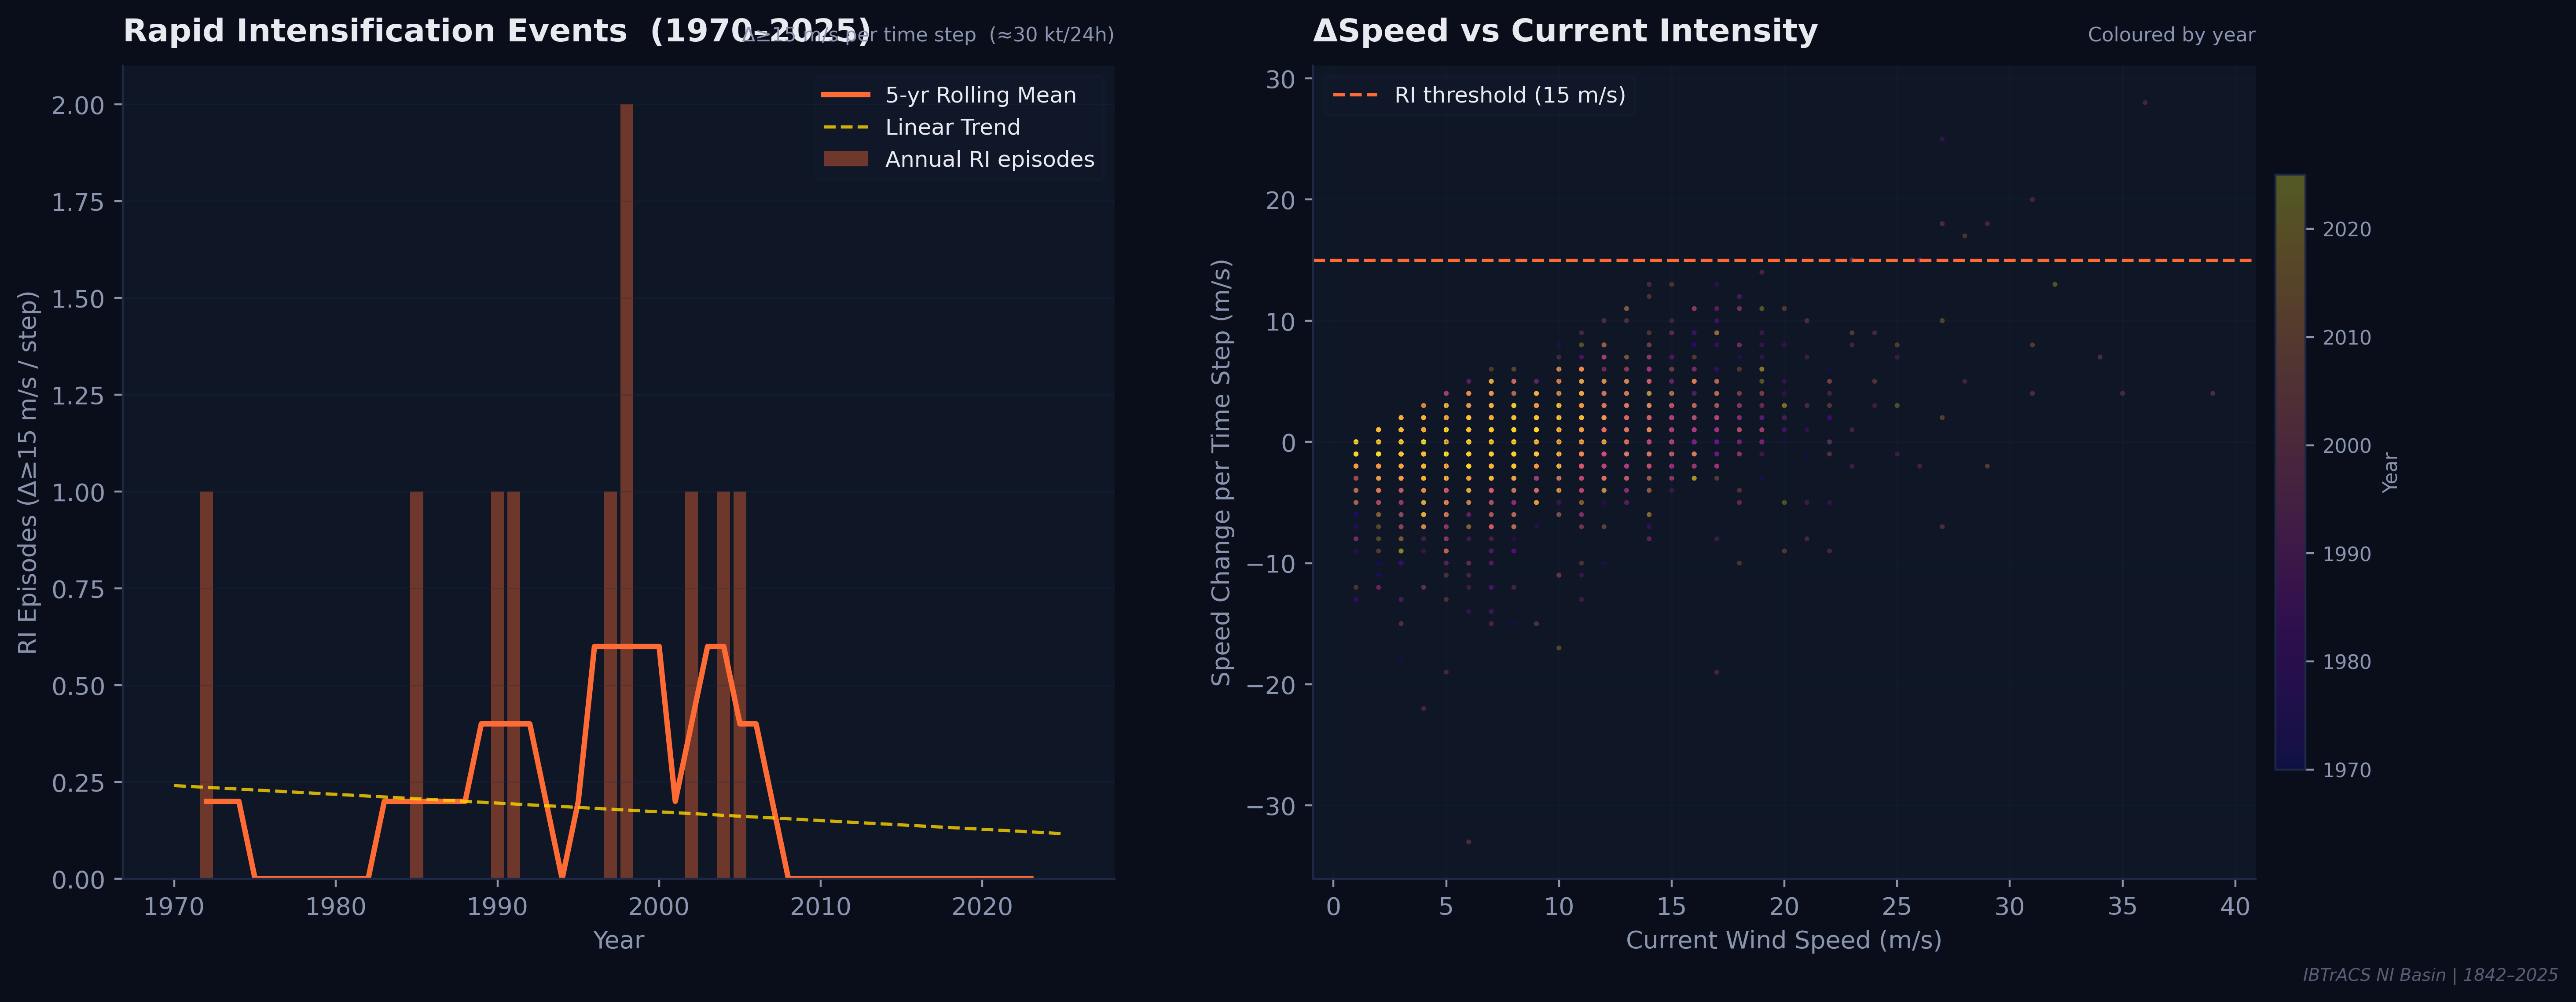
Rapid Intensification (RI) — defined here as a wind speed increase of ≥15 m/s per time step (~30 kt/24h) — is sporadic in the Bay of Bengal. The left panel shows RI events peaked around 1996–2000 and have trended slightly downward since, though data limitations in early decades complicate interpretation.
RI remains the hardest problem in tropical cyclone forecasting. Even 24-hour advance warning of an RI event can cut casualties dramatically — making these rare data points disproportionately valuable for model development.
Climatology Dashboard
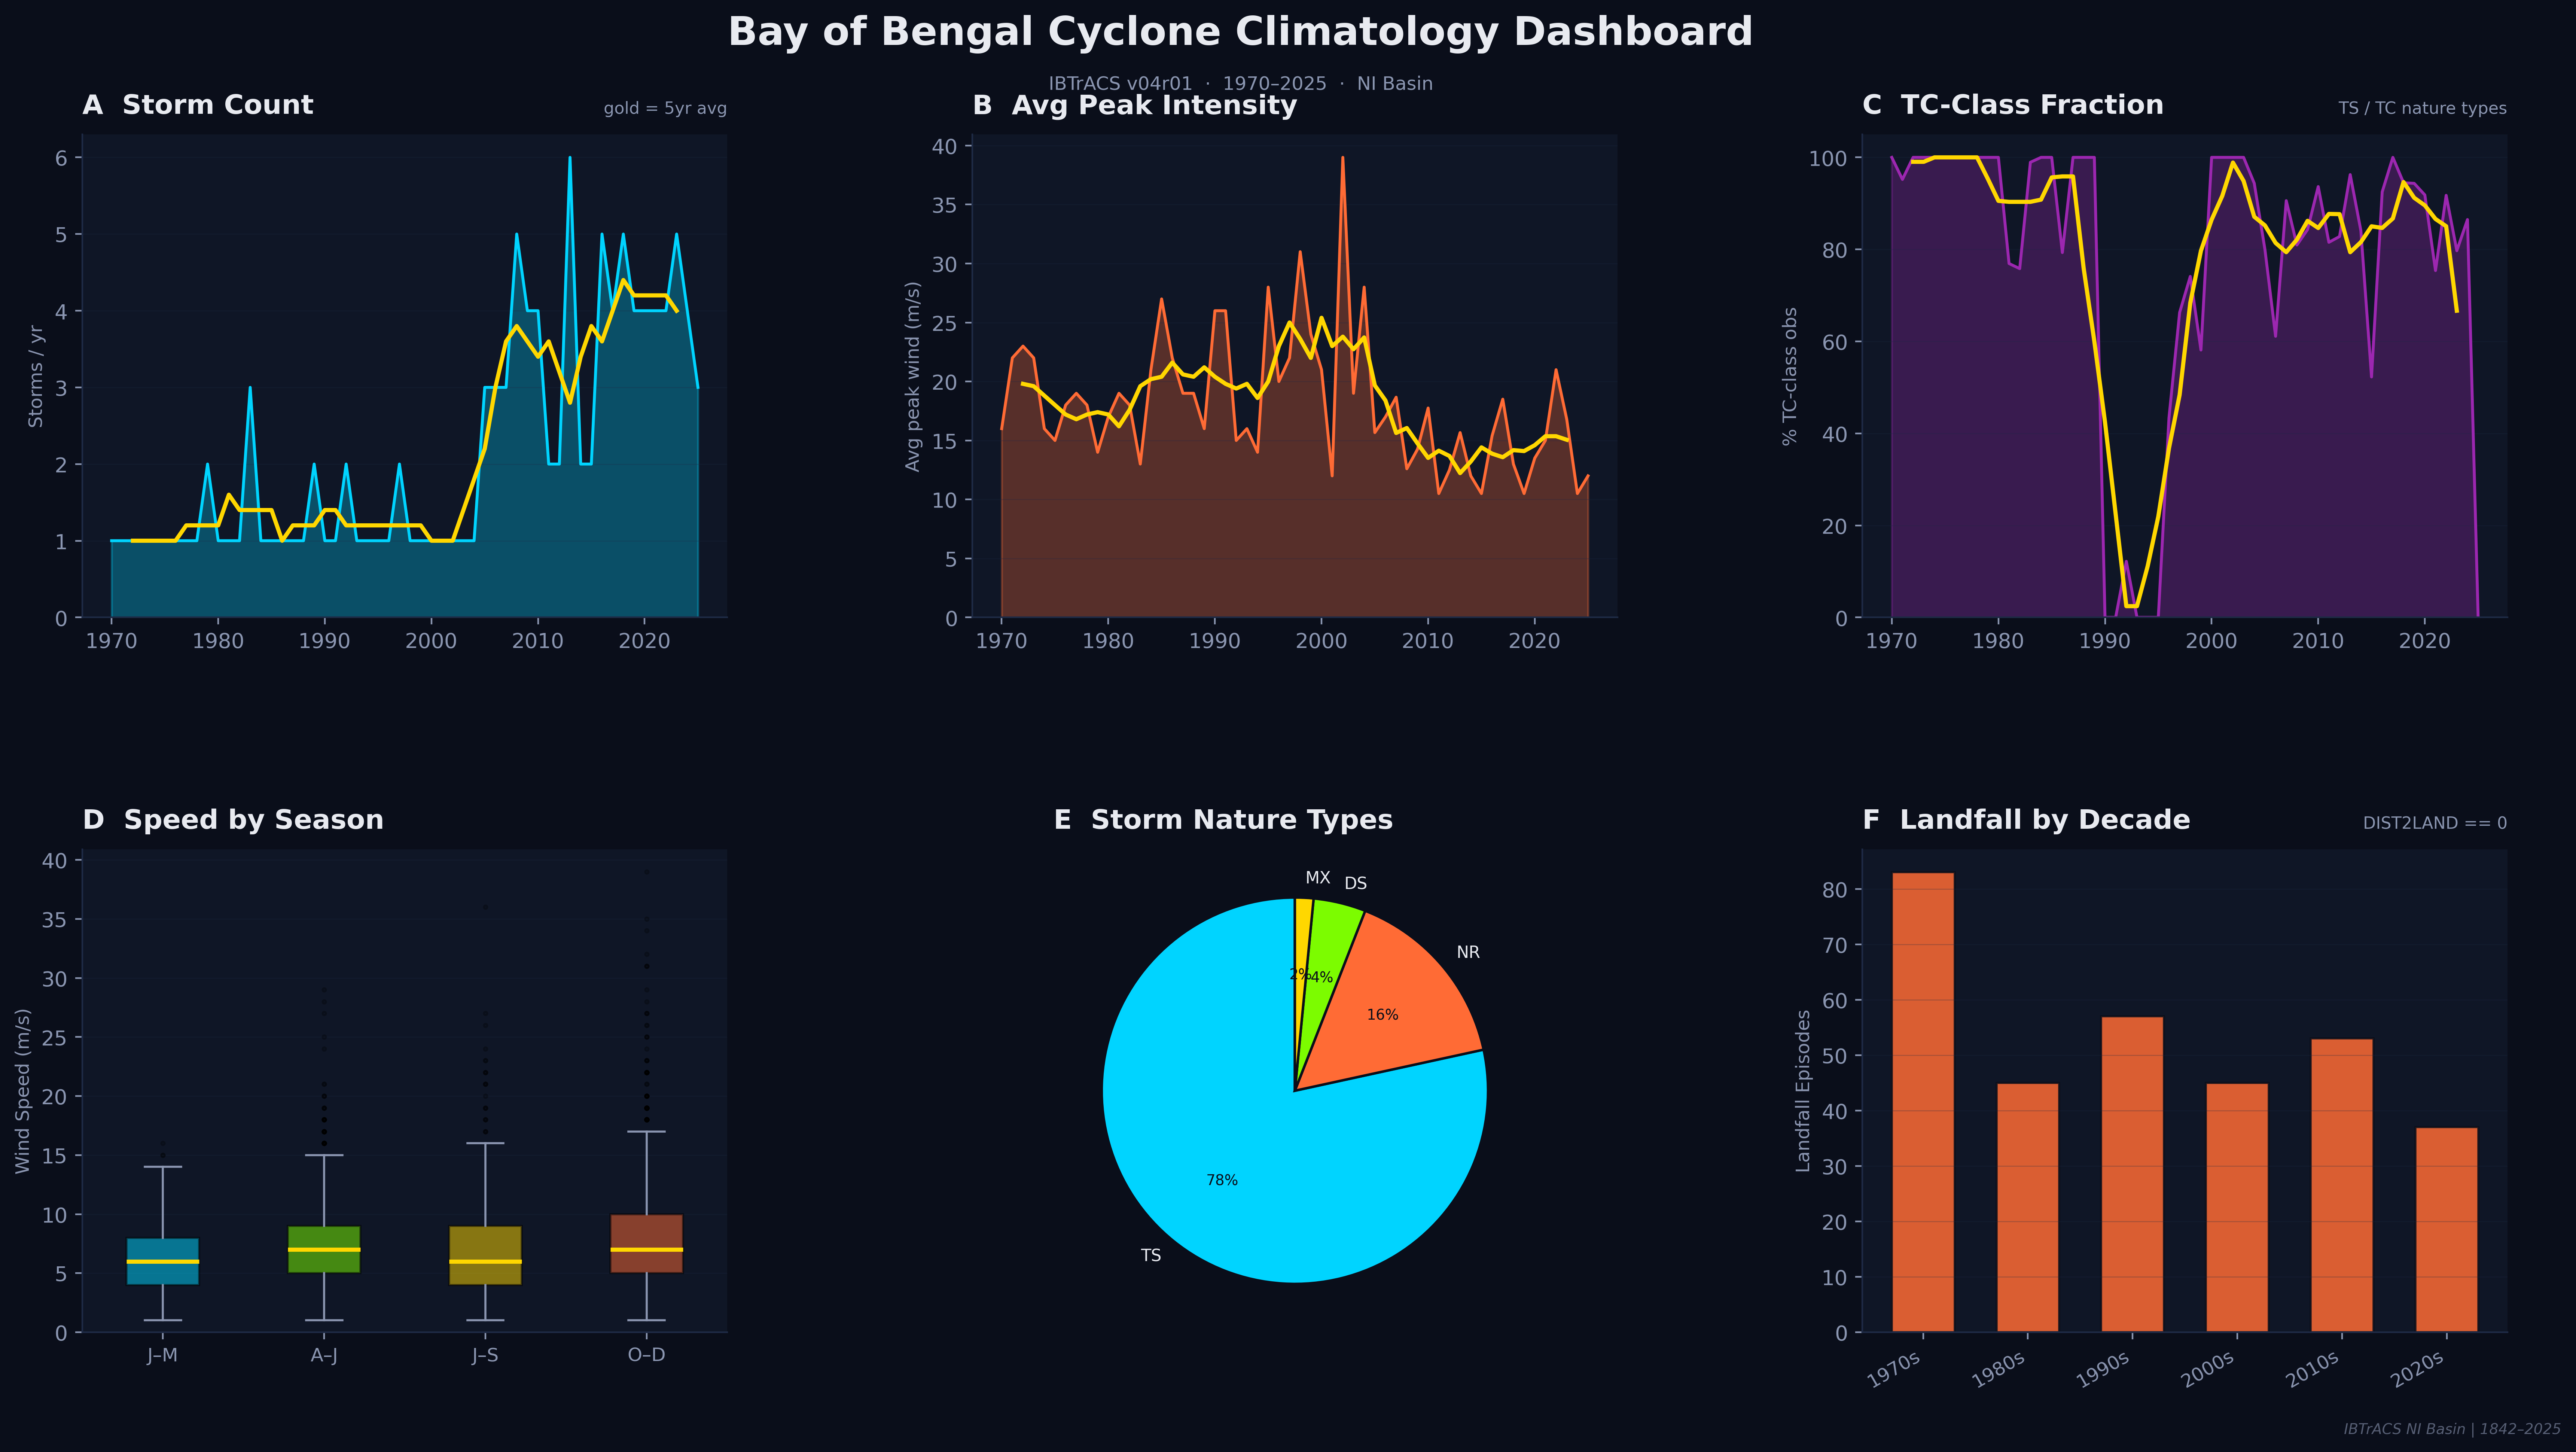
The summary dashboard synthesises the entire 55-year modern record into six complementary views. Together they paint a coherent portrait: a basin with surging storm counts, stable-to-declining average intensity, a dominant Tropical Storm classification, a landfall record skewed toward the 1970s–80s, and an October–December season that has grown markedly more active.
What the data tells us
Storm frequency has risen sharply over the instrumental record. The post-monsoon season has grown markedly more active since the 2000s. While individual storm intensity has not uniformly increased, more storms means more chances for a destructive event. For over 400 million people living in the Bay's coastal zone — from Odisha to Myanmar — understanding these patterns is a matter of survival.
Data: IBTrACS v04r01 · NOAA/WMO · NI Basin 1842–2025